T-test Leakage Assessment
T-test Flow
Welch’s T-test is used as a tool for leakage assessment. This guide describes using FOBOS to perform a fixed-vs-random t-test.
To perform a t-test you need to generate test-vectors that interleaves fixed and random traces. FOBOS data acquisition is run to get the traces, then the traces are splitted into two sets and the statistical Welch’s t-test is performed.
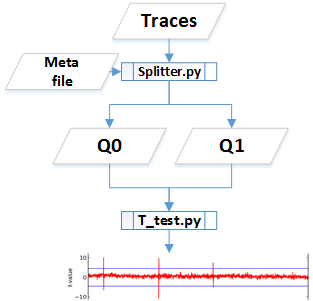
T test flow
Test vector generation
The user generates the test-vector file and a meta file that specifies which test vectors are random and which are fixed. Fixed-vs-random t-test uses interleaved fixed and random test vectors. We can select a fixed test vector D and create a set of test vectors that interleaves D and a randomly selected test vector. The interleaving is random. For example the following test vector can be used to perform a t-test on an algorithm implemented on FOBOS DUT.
00C001607000000020000000D600000CB0B1B2B3B4B ...
00C001607000000020000000D600000C0EEB8882501 ...
00C001607000000020000000D600000CF402296C454 ...
00C001607000000020000000D600000CB0B1B2B3B4B ...
00C001607000000020000000D600000CE919E2FC539 ...
00C001607000000020000000D600000CB0B1B2B3B4B ...
00C001607000000020000000D600000CB0B1B2B3B4B ...
.
.
The corresponding fvrchoicefile specifies which traces are random ‘1’ and which are fixed ‘0’. For example the fvrchoicefile that corresponds to the test-vectors above is
0110100 ...
See Test Vector Generation for more information.
Peforming a t-test
Once traces have been collected, scripts are used to perform the t-test.
1- Copy the cleanTraces.py, splitter.py and t-test2.py scipts from fobos/software/tools/t-test to the locatation where you have the power traces you collected.
2- Make sure you have your trace file named powerTraces.npy and your fvr choice file named fvrchoicefile.txt. These files need to be at the same directory as the scripts copied in step 1.
3- Convert the power traces format using the read_traces.py. Blow, you can find the parameters used with this script.
$ python read_traces.py -h
###### readtraces.py script
usage: read_traces.py [-h] source_file destination_file num_of_traces

positional arguments:
source_file       Traces from FOBOS dataAcquisition
destination_file  .npy file that store traces as MxN Nupmy array.
num_of_traces     .npy file that store traces as MxN Nupmy array.

optional arguments:
-h, --help        show this help message and exit
For exmple, the following command takes the powerTraces.npy file and coverts it to cleanTraces.npy and it uses only the first 2000 traces.
python read_traces.py powerTraces.npy cleanTraces.npy 2000
4- Next, we split the cleanTraces.npy file into two trace files
- traces0.npy for the traces that came from the fixed test vector
- traces1.npy for traces that came from using the random test vectors.
To do this, splitter.py needs the fvrchoicefile.txt file. It also needs to know how many traces to consider. These are configurable parameters in the script. Here is all the parameters you can edit in splitter.py:
######Parameters
MAX_TRACE=2000
traces0File = 'traces0.npy'
traces1File = 'traces1.npy'
fvrFile = 'fvrchoicefile.txt'
cleanTraceFile = 'cleanTraces.npy'
##########################
Once you configure the parameters, you can run splitter using:
python splitter.py
The reuslt will be 2 files called traces0.npy and traces1.npy.
5- The two files are now ready to be fed into the t-test2.py script to perform the t-test. Here are the parameters that this script needs:
$ python t-test2.py -h
usage: t-test2.py [-h] trace_file0 trace_file1 plot_file

positional arguments:
trace_file0  .npy file that store traces as MxN Nupmy array
trace_file1  .npy file that store traces as MxN Nupmy array
plot_file    File name to store the output figure

optional arguments:
-h, --help   show this help message and exit
Before running the script, also edit the plotting parameters in the script. These parameters specify the limits on the x and y axis.
# Parameters ########
start_ylim = -40
end_ylim = 40
start_xlim = 0
end_xlim = 1000
#####################
This limits the t-values to -40-40 and displays samples from 0 to 1000 on the x-axis.
Once you configure all the parameters, you can run the t-test using the following command.
python t-test2.py traces0.npy traces1.npy result_t_test.png
The output will be a file called result_t_test.png that shows the t-values on the y-axis and samples in the x-axis. Here is sample file that shows a failing test and a successful one:
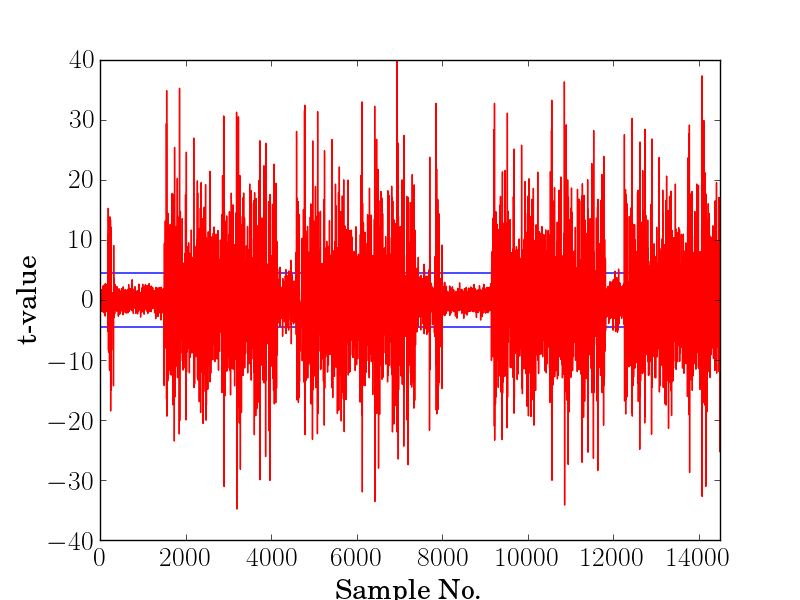
T test on an unprotected AES-GCM implementation.
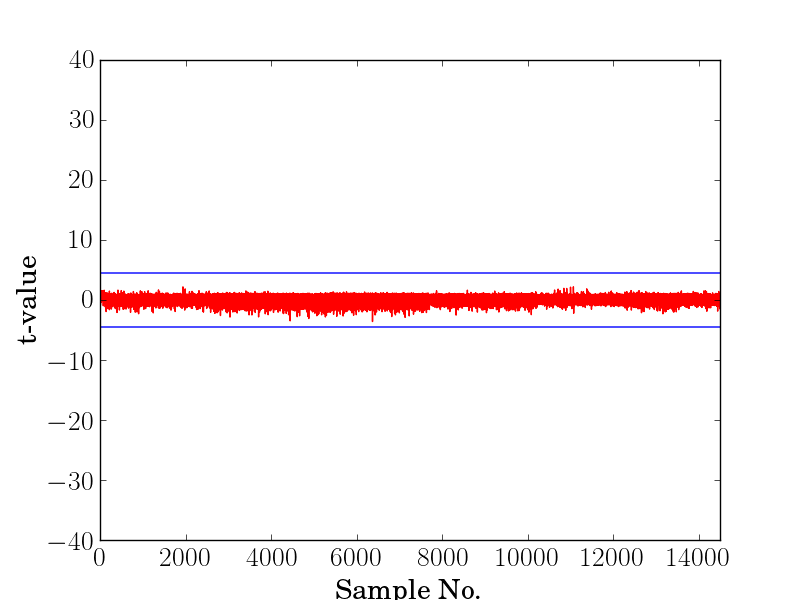
T test on a protected AES-GCM implementation.